


Diagrams: Show Me
I create and display various types of diagrams based on user requests, such as sequence, graph, mindmap, timeline, and entity-relationship diagrams.
What does Diagrams: Show Me do? (& its Use Cases)
Diagrams: Show Me turns your ideas into clear, visual diagrams to enhance your understanding and communication.
From complex data to simple concepts, I transform your thoughts into visual formats, making them easier to grasp and share.
For Educators and Students
I help in creating educational diagrams that simplify complex subjects for effective teaching and learning.
For Project Managers and Teams
I assist in visualizing project timelines and workflows, aiding in planning and team coordination.
For Developers and Technical Professionals
I generate technical diagrams like sequence and entity-relationship diagrams to streamline documentation and design.
How to Use Diagrams: Show Me?
Getting Started with Diagrams: Show Me
Identify Your Diagram Needs
- Determine what you need to visualize (e.g., processes, timelines, relationships).
Request a Diagram
- Simply ask for the type of diagram (sequence, graph, mindmap, timeline, entity-relationship).
Specify Details (Optional)
- Provide specific details or data points you want included in the diagram.
Customization Requests (Optional)
- Request specific styles or formats (like PlantUML) if you have a preference.
Review the Diagram
- Once I generate the diagram, review it to ensure it meets your needs.
Request Edits (If Needed)
- If adjustments are needed, feel free to ask for modifications.
Explore Further (Optional)
- Use phrases like "explore diagrams" or "show ideas" for additional options and creativity.
Diagrams: Show Me's Testing Performance
Diagrams: Show Me's Core Features
Dynamic Diagram Generation
When you need to visualize complex information, I can generate various types of diagrams like sequence, graph, mindmap, timeline, and entity-relationship. This feature transforms abstract data into a clear visual format, making it easier to understand and analyze.
Customizable Diagrams
I offer customization options for diagrams. Whether it's a specific layout, style, or data representation, this feature allows the diagrams to be tailored to your specific needs, ensuring the final visualization is exactly as required.
Multiple Language Support
If you prefer diagrams in a specific language like Mermaid or PlantUML, I can accommodate that. This feature is particularly useful for users familiar with these languages, providing diagrams in a format they are comfortable with.
Interactive Modification
Need changes to your diagram? I can iteratively modify diagrams based on your feedback. This feature ensures that the final output is a refined representation of your requirements, improving accuracy and relevance.
Visualization Exploration
Not sure which diagram type is best? I can suggest and showcase different types of diagrams, helping you explore various visualization options. This feature aids in discovering the most effective way to present your data or idea.
Source Code Provision
Upon request, I can provide the source code for any diagram created. This feature is ideal for users who wish to understand the diagram's structure in depth or need to make advanced customizations themselves.
Diagrams: Show Me's Explainer Video
FAQs from Diagrams: Show Me
Diagrams: Show Me's Prompt Examples
Visualizing Data and Processes
Show me a sequence diagram of a user logging into a website.
Create an entity-relationship diagram for a small e-commerce database.
Generate a graph showing the organizational structure of a tech company.
Project Planning and Management
Create a timeline for the development stages of a mobile application.
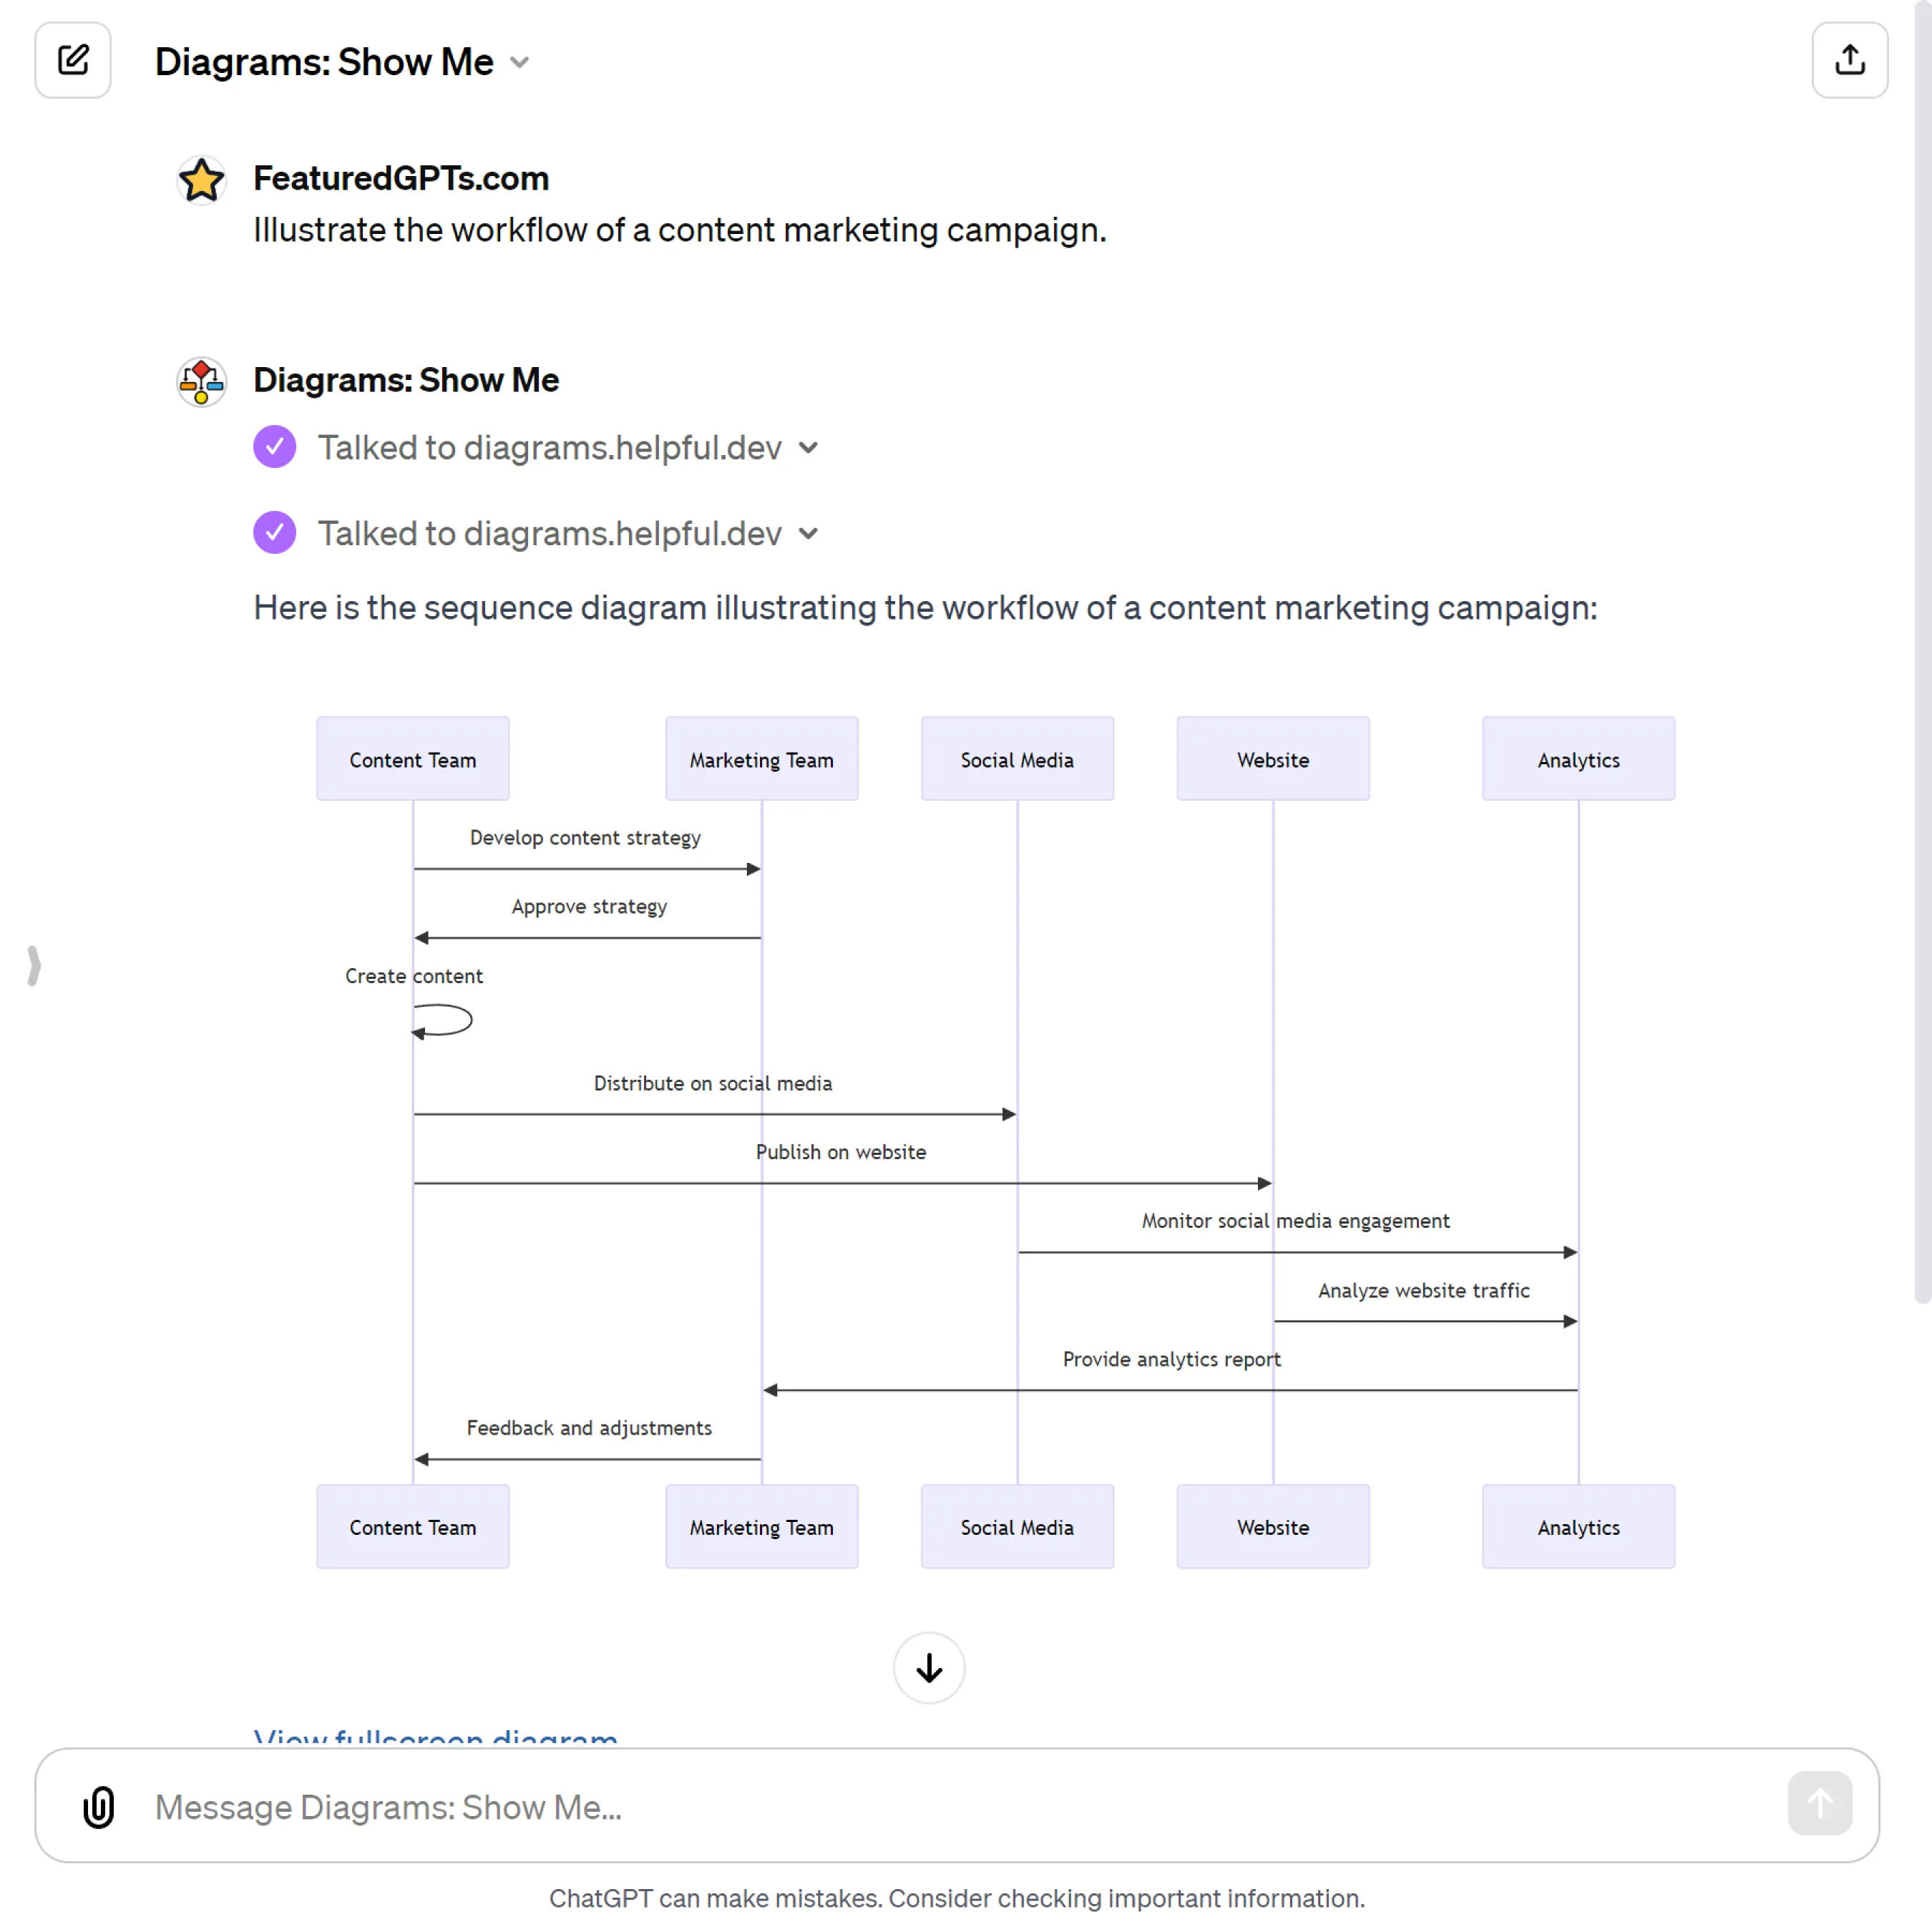
Illustrate the workflow of a marketing campaign using a sequence diagram.
Depict the milestone achievements in a construction project on a timeline.
Educational and Learning Tools
Generate a mindmap summarizing the key concepts of machine learning.
Show an entity-relationship diagram to explain the structure of a relational database.
Create a graph illustrating the food chain in a marine ecosystem.
Brainstorming and Idea Organization
Develop a mindmap to explore potential features for a new software product.
Create a graph to organize the main themes for an upcoming conference.
Generate a mindmap to outline the chapters of a novel.
Technical Communication and Documentation
Illustrate the architecture of a microservices system using a graph diagram.
Show a sequence diagram for API interactions in a distributed system.
Create an entity-relationship diagram for documenting a legacy database system.
Personal Use and Organization
Generate a timeline of personal milestones and key life events.
Create a mindmap to plan a personal fitness and diet regimen.
Illustrate a graph of my personal budget and expense categories.
Diagrams: Show Me's Conversation Examples
There is no conversation shared here yet. Feel free to submit your shared chat!